The Q4 2026 global hotel outlook
:format(webp))
Forward demand, advertised rates and source-market movement for stays between October and December 2026, across seven regions and more than 500 destinations.
Amid a year of uncertainty, it was always going to be a question of whether travel demand would hold through the year. Looking ahead into the fourth quarter of 2026 - and using Lighthouse data to monitor it - it largely has.
On the face of it, across most regions, forward demand for hotels remains close to where it stood at the same point in last year's booking cycle, despite a year of economic pressure, changing travel patterns and geopolitical disruption.
Advertised rates, however, are moving in markedly different directions. In some markets, rates and forward demand are both higher than in previous years. Elsewhere, substantial rate increases accompany little change in demand from last year.
For hoteliers, broadly stable demand creates both opportunity and exposure. Markets where demand has strengthened while advertised rates remain restrained may have room to improve their advertised position, particularly over the quarter's strongest dates. Those where rates have risen much faster than demand face a harder test as arrival approaches.
The defining question for Q4 is therefore not whether travelers are still looking, but whether each market's current rate is aligned with the demand forming for its most opportune stay dates.
Key findings
Broadly stable forward demand accompanies sharply different rate movements. Advertised rates vary much more widely than forward demand, with some increases accompanied by stronger demand and others by little change from last year.
The largest advertised-rate increases are often concentrated around specific stay dates. In several markets, events and seasonal peaks are driving sharp increases over specific periods rather than across the quarter as a whole.
A broader mix of source markets is making hotel search more resilient. Destinations gaining interest from domestic and regional travelers are better able to offset weaker long-haul search, while those losing interest across their main source markets face a more widespread decline.
US hotel markets show the most widespread weakness. Advertised rates, forward demand and hotel search are all lower at the median. Canada differs: advertised rates and domestic hotel search are higher, despite slightly weaker forward demand.
Africa
Red Sea rates rise with demand; Cape Town's increase outpaces it
Egypt's Red Sea coast has Africa's clearest alignment between rising advertised rates and demand. Sharm El Sheikh's rate is up 21.9% YoY in USD, after increasing 26.4% last year, while Hurghada is up 18.6% following a 26.5% YoY increase in 2025.
Hotel search has grown by 7.4% for Sharm El Sheikh and 7.8% for Hurghada, while forward demand for Q4 stays is slightly ahead of the same point last year.
Travelers are showing keen interest in Sharm El Sheikh, with search volume surging across key European markets like France, Sweden, Germany, and the UK, alongside Turkiye – offsetting dips from Russia and Israel (even as Russia remains the largest search origin).
Thanks to a favorable exchange rate, the resort's all-inclusive luxury packages offer budget-conscious European and middle-income vacationers a far more affordable getaway than traditional western Mediterranean hotspots.
Hoteliers are capitalizing on this momentum: rate growth peaks during the shoulder season with a massive 32.6% hike in October, before easing to 24.4% in November and 9.6% in December.
Cape Town’s advertised rate is rising much faster than demand. It is up 28.7% in dollars and 18.3% in rand, while forward demand is virtually unchanged from last year. July hotel search fell 12.7%, including a 25.3% decline from within South Africa, and short-term rental listings increased by 22.2% YoY.
A widening divide in the city's visitor economy helps explain the tension: strong overseas spending is supporting Cape Town's premium tourism market, while domestic travelers are staying for less time and spending less as household budgets tighten. Higher advertised rates therefore coincide with a market with growing international spending power but greater price pressure on South African guests.
Cape Town's demand picture is stronger at the end of December. Forward demand for the final ten days of 2026 is substantially higher than last year, but December 7–20 is only slightly above Cape Town's usual level. The higher rates align more closely with demand over the year-end peak than during the preceding weeks.
Softer South African interest extends beyond the domestic market, with searches from South Africa for hotels in Mauritius down 18.6%.
Lower rates accompany different demand trends
Seychelles’ Q4 advertised rate is down 12.8% YoY, with lower rates in all three months, reversing the 12.0% increase recorded between 2024 and 2025. Forward demand is nevertheless stronger than at the same point last year, while hotel search has fallen 8.0%. The destination's dependence on one-stop connections through Dubai, Doha and Abu Dhabi left it particularly exposed when airport closures, flight suspensions and rerouting disrupted Gulf hubs earlier in 2026. Those travel disruptions compounded weaker interest from Germany, Russia and India, although growth from France, Italy, Poland and Türkiye provided some offset.
Mauritius is recording more hotel searches without yet seeing stronger Q4 forward demand. Hotel search is up 20.7%, led by growth from Europe and Türkiye, although search from South Africa has fallen 18.6% YoY. Forward demand remains below last year and the Q4 advertised rate is down 6.8% YoY, its second consecutive annual decline. Mauritius typically fills late, so bookings may strengthen closer to arrival. For now, higher hotel search coincides with lower Q4 forward demand and advertised rates than last year.
Nairobi’s hotel search volume is softening even as Q4 forward demand holds slightly ahead of last year. Searches dropped 33.1% YoY, driven by sharp declines from key origin markets including the United States – previously its largest source – alongside India and domestic Kenyan search. As a commercial center and safari gateway, Nairobi has yet to capture enough interest from alternative markets to offset these losses. Consequently, its Q4 advertised rate is down 4.2% YoY and 19.8% compared to Q4 2024.
Morocco: on the back of AFCON
Agadir enters Q4 with hotel search up 22.0%, forward demand modestly ahead and its advertised rate only 1.8% higher at $117. The city hosted six Africa Cup of Nations (AFCON) matches in December 2025, yet demand for December 2026 is only slightly lower. Stronger October and November demand keeps the quarter ahead overall.
Rabat has not held up as well. Its forward-demand decline is confined to December, when the city has no equivalent to the six tournament fixtures it hosted in 2025. Its December advertised rate is down 17.9%, but October is up 14.1% and the Q4 rate remains 13.4% above 2024.
Marrakech shows a similar correction. Its Q4 advertised rate is down 8.4% after rising 17.5% last year, leaving it 7.7% above 2024. The decline reaches 14.9% in December, when demand is also below the market's usual level for four consecutive weeks.
With the 2025 Africa Cup of Nations in the rear-view mirror and the 2030 World Cup on the horizon, Morocco is firmly in the global spotlight. Boosted by major investments in flight connectivity and hospitality infrastructure, the kingdom's tourism momentum is showing impressive staying power. Agadir offers a promising glimpse of life after the spotlight: hotel searches from northern Europe are on the rise, while forward demand and room rates remain reassuringly steady.
Asia
Asia's median advertised rate is down 1.7% YoY, while regional forward demand has changed little. Japan and China both have lower median rates, but the more significant differences emerge between individual destinations and stay periods.
Japanese rates ease as forward demand strengthens
Kyoto combines stronger forward demand with lower advertised rates. Demand is particularly strong in November, when the week beginning November 23 rises to more than twice the market’s usual level, yet the month’s advertised rate is down 5.2% YoY to $276.
By early August, 46.9% of Kyoto’s Q4 room inventory was already booked, compared with 34.3% in Osaka and 27.5% in Singapore. The share of inventory already booked is highest in October at 63.2% and November at 53.0%, reinforcing the contrast between its autumn demand and lower November rate. Short-term rental listings have also increased by 31.9%, expanding the alternative-accommodation market during the autumn peak.
Forward demand in Kanazawa is ahead in all three Q4 months, hotel search has risen 11.1%, and demand for the week beginning November 16 is more than twice the market’s usual level. Its November advertised rate is nevertheless down 3.5% YoY. Advertised rates in both Kyoto and Kanazawa rose substantially between Q4 2024 and Q4 2025. 2026 Q4 advertised rates are lower than previous years, even though forward demand is stronger than it was last year.
Japan’s hotel search mix is changing at the same time. Chinese search has dropped across all nine Japanese markets examined, including declines of 68.2% for Osaka, 60.2% for Kyoto and 33.8% for Tokyo. In Kyoto, increased search from Japan and South Korea has partly countered the loss of Chinese interest.
Despite these localized shifts and source-market adjustments, Japan’s broader tourism market paints a far more resilient overall picture. While national arrivals from China dropped sharply in July, visitors from the United States and several European countries reached all-time highs for the month. A favorable exchange rate continues to give overseas guests extra spending power, even as Japan introduced a higher international tourist tax in July – a shift that has done little to check Q4’s ongoing forward momentum.
This national resilience is also evident in Osaka, where underlying demand remains firm even as rate comparisons appear distorted. Osaka’s 20.8% YoY rate decline largely reflects the comparison with Expo 2025, which ran until October 13. Its Q4 advertised rate remains 6.7% above 2024, however, while forward demand for November and December is ahead of last year.
China's rates are lower, while other markets vary by stay period
China's median advertised rate across 14 markets is down 5.0% YoY in US dollars and 11.4% from Q4 2024, while forward demand is broadly unchanged. This is happening despite growth in domestic trips and international arrivals. Domestic tourism spending has risen more slowly than trip volumes, while the hotel development pipeline continues to expand, increasing competition for that demand.
Chengdu shows the pressure most clearly. Its advertised rate is down 26.3% YoY, with similar reductions in all three Q4 months, while hotel search has fallen 21.1%. Chengdu also has China's largest hotel development pipeline by number of projects. The evidence does not establish whether new supply caused the lower rates, but rates and hotel search are both down as additional capacity is developed.
Shenzhen's November rate is up 33.1% as forward demand rises sharply during the weeks beginning November 9 and 16. Rates are lower in October and December, making this a two-week peak rather than a broader quarterly change.
Thailand’s Andaman and Gulf coasts show contrasting Q4 outlooks. Forward demand is stronger YoY across the Andaman coast destinations of Khao Lak, Krabi and Phuket, with Khao Lak’s growth widening into December. Its December advertised rate is nevertheless only 2.1% higher YoY in US dollars. Conversely, on the Gulf coast, Koh Samui and Ko Pha Ngan remain close to or below their usual demand levels during their peak wet season.
Kaohsiung stands apart within Taiwan. Its advertised rate is up 7.5% across Q4 and 17.0% in November, while both forward demand and hotel search have also increased. Growth in searches from the Philippines, Japan, South Korea and Thailand has outweighed declines from Hong Kong, mainland China and the United States. The higher advertised rate contrasts with double-digit reductions in Taipei and Taichung.
Singapore's 7.1% YoY advertised rate growth is concentrated around the Formula 1 period and late December. November's advertised rate and forward demand are broadly unchanged from last year, while demand during much of the remaining quarter is closer to the market's usual level.
Phu Quoc combines substantially higher advertised rates with stronger forward demand, even as its alternative-accommodation market expands. Its Q4 rate is 48% above 2024, including a 57% increase in December, while short-term rental listings have risen 91% over the same period.
Europe
Europe's forward demand remains close to last year's position, but advertised-rate changes vary across markets. The clearest increases appear around major events and seasonal peaks, while several destinations are advertising similar or even lower rates despite stronger demand. Hotel search is also becoming more regional as increased European interest offsets weaker search from the United States in most markets.
Major events create the clearest pricing opportunities
Madrid's advertised rate is up 11.0% YoY in euros across Q4, with almost all of the increase concentrated in two October congress weeks. Rates in those weeks are about 50% higher than in the week between them, aligning the strongest pricing with demand around Fruit Attraction, ESMO and Matelec.
Saint-Malo's advertised rate is up 27.6% YoY in euros, the largest increase among the selected European markets. The growth is concentrated in the two weeks covering the Route du Rhum race village, when rates rise to 1.6 and 2.3 times the surrounding level before falling back immediately afterwards.
Cardiff's advertised rate and forward demand are both higher: its advertised rate is up 9.2% in GBP as forward demand records Europe's largest YoY increase, led by three rugby internationals and a soccer fixture within 15 days in November.
Nuremberg has a more sustained demand position. Forward demand remains elevated in October, November and December as trade fairs give way to the Christmas market. Its advertised rate is 7.8% higher than last year and 5.8% above the last comparable event year in 2024, both measured in euros. Unlike Madrid and Saint-Malo, its pricing opportunity extends across all three months rather than a small number of stay dates.
Stronger demand is not always translating into higher rates
Helsinki's advertised rate is 8.0% lower YoY in euros despite stronger forward demand than in both 2025 and 2024. Rates are lower in all three Q4 months, while hotel search has risen 8.7%. More than half of Helsinki's 2,702 short-term rental listings have a hotel-like configuration, adding substantial alternative supply to the market.
Turin's forward demand is stronger than in both prior years and reaches its highest level in November around the ATP Finals, yet its Q4 advertised rate is virtually unchanged in euros and its December rate is 2.0% lower.
In Vienna, advertised rates and forward demand have both increased. Its advertised rate is up 7.7% YoY, forward demand has risen for a second year and 31.2% of its Q4 room inventory was already booked by the end of August.
Manchester's Q4 advertised rate is down 2.6% YoY in GBP as accommodation supply continues to expand without comparable growth in forward-looking demand. Forward demand is below both prior years, hotel search is broadly flat and only 17.2% of its Q4 hotel inventory had been booked by the end of August. Short-term rental listings have also risen 24.8% over two years. More hotel rooms and rental properties are competing for demand that has not grown to match the additional supply.
US search weakness is concentrated in near-term stays
US hotel search for Europe fell sharply in May and June. Around nine in ten markets recorded YoY declines in each month, and the median market was down about 26%. The downturn eased in July, although it remained widespread: 78% of markets recorded fewer US searches, the median decline narrowed to 17.1% and total US search was down 13.8%.
Despite weaker US interest, total hotel search for Europe rose 13.5% in July. Of the 141 markets losing US search, 113 still recorded total growth as interest from other origins increased.
The decline also appears less pronounced for later stays. US search for Santorini fell 45.7% at seven days or less before arrival, compared with 18.8% at 90 days or more. Dublin and Florence show the same pattern, with short-lead declines of 42.2% and 49.4% narrowing to 19.9% and 20.8% at longer lead times. Forward demand for Q4 stays is nevertheless higher than last year in all three destinations. The fall in US search therefore points to weaker near-term interest, rather than a broader loss in their Q4 outlook.
For Americans who do travel, the weaker dollar presents a separate challenge. The median European market's advertised rate is 4.6% higher than in 2024 when measured in euros, but 12.1% higher after conversion into dollars. European stays therefore appear materially more expensive to US guests than hotels' underlying rate movements alone suggest.
Latin America
Forward demand across Latin America and the Caribbean remains close to last year, but stronger regional currencies are making some destinations more expensive for guests paying in US dollars. Across the markets covered, the median Q4 advertised-rate increase is 13.5% in dollars, compared with 5.6% in each market’s local currency. In Medellín, the currency effect reverses the direction: advertised rates are 4.4% lower in Colombian pesos but 13.3% higher in dollars.
Domestic hotel search grows as Foz do Iguaçu's rates rise
Foz do Iguaçu, on Brazil's border with Argentina and home to Iguaçu Falls, has the region's largest advertised rate increase. Its Q4 rate is up 28.5% in reais, or about 40.5% in US dollars, with the difference reflecting the stronger real.
Domestic interest has also strengthened. July hotel search from within Brazil increased 110.4% YoY, taking Brazil's share of tracked searches from 71% to 86%, while Argentine search fell 15.6%. Q4 forward demand is slightly ahead of last year, although the improvement is concentrated in October; November is broadly unchanged and December slightly lower.
Balneário Camboriú shows that Brazil's rate growth is not across the board. Its Q4 advertised rate is virtually unchanged YoY in reais, while forward demand is lower in October and November and broadly flat in December. These are shoulder-season months for a coastal resort whose main influx arrives with the South American summer.
This follows an exceptional 2025 summer season, when favorable exchange rates helped drive unusually high spending by Argentine visitors. Average visitor-group spending across the Santa Catarina coast subsequently fell 16.4%, including a 17.5% decline among Argentine groups. Balneário Camboriú now enters the following summer with lower forward demand in October and November, although December is unchanged from last year.
Canadian search rises for Barbados but falls for Jamaica
Jamaica is still recovering from Hurricane Melissa, with hotel capacity returning during 2026. July hotel search from its two largest North American origins fell YoY: the United States by 18.6% and Canada by 20.6%. Its Q4 lowest advertised rate is down 12.2% to $366, despite forward demand being modestly ahead of last year.
The Q4 2025 benchmark uses rates advertised before Hurricane Melissa, when hotels were still expecting a normal season. This year's lower advertised rates coincide with returning hotel capacity and weaker hotel search from the United States and Canada.
Barbados's Q4 advertised rate is up 14.8% YoY to $455 and forward demand is stronger despite a similar 21.5% fall in US search. Canadian search increased 38.3%, partly offsetting the decline in US search, while UK search was only 2.4% lower than at the same point in 2025.
The Libertadores final shifts November demand from Lima to Montevideo
The Copa Libertadores final has transferred a high-demand November week from Lima to Montevideo. Forward demand for the week containing the November 28 final in Montevideo is 49.9% higher than for the corresponding week last year, while its Q4 advertised rate is up 11.3% YoY in dollars.
Interest from neighboring countries has also grown alongside stronger forward demand for the final week. July hotel search from Brazil increased 30.3% YoY and search from Argentina rose 18.1%.
Lima faces the reverse effect. Its largest YoY forward-demand decline falls in the week that hosted the 2025 Copa Libertadores final. That single match attracted 70,048 spectators, while associated travel brought 51,000 tourists to Peru and generated an estimated US$86 million in economic impact. Its move to Montevideo therefore removes a substantial source of accommodation demand from one week in November 2026.
While the final’s relocation explains the sharp November demand comparison, Lima’s softness extends across the entire quarter. Its Q4 advertised rate is down 3.9% YoY to $112, July hotel search fell 20.4% with drops across all tracked origins, and December rates ($104–106) remain far below the early-October peak of about $130.
Middle East
The Middle East's median Q4 advertised rate and forward demand are both close to last year's position, but that apparent stability conceals wide differences between destinations and stay dates. The strongest pricing opportunities are concentrated around international summits and Formula 1, while several markets are advertising lower rates than last year in all three Q4 months.
Dubai's Q4 hotel outlook remains broadly stable despite severe disruptions earlier in 2026. Its advertised rate is 1.1% higher YoY, while forward demand is slightly below last year overall. Demand for October and November is lower than for the same months in 2025, with December slightly ahead.
Summits and Formula 1 bring the strongest rate peaks
Antalya and Yerevan have the region's largest event-led increases. Antalya's November advertised rate is up 49.8% YoY in euros as COP31 runs from November 9 to 20. Forward demand is stronger only in November and peaks during the two conference weeks; October and December are essentially unchanged from last year.
Yerevan's October advertised rate is up 55.3% in Armenian dram during the UN Biodiversity Conference, alongside a sharp increase in forward demand. The rate increases narrow to 5.4% in November and 4.0% in December, when forward demand is slightly lower than last year. In both markets, the pricing opportunity is concentrated around the summit dates rather than extending across Q4.
Formula 1 creates a concentration of demand later in the quarter. Demand during Qatar Grand Prix week is roughly twice Doha’s usual level, followed immediately by Abu Dhabi Grand Prix week at nearly three times that market’s usual level. Abu Dhabi records another spike during ADIPEC from 2–5 November, when its lowest advertised rate reaches $568 – slightly above the $562 recorded for Grand Prix week. Across Q4, Abu Dhabi’s advertised rate is up 9.7% YoY.
Doha's 14.3% YoY rate decline needs the context of December 2025, when the city hosted the FIFA Arab Cup. Its Q4 advertised rate is 14.7% higher than in 2024, while November 2026 also benefits from the Qatar Grand Prix. The event calendar therefore explains both the current peak and the unfavorable comparison with last year.
Jeddah and Bodrum advertise substantially lower Q4 rates
Jeddah’s Q4 advertised rate is down 21.0% YoY and 17.0% from 2024, with declines across all three months. The city enters the quarter after months of regional conflict and significant disruption to flights serving Saudi Arabia, while forward demand is slightly below last year. Short-term rental listings have also more than doubled since 2024, adding further competition for demand.
Bodrum has the region’s largest decline, with its Q4 advertised rate down 26.9% YoY in euros and lower in every month. Regional conflict, rising costs and later bookings have weighed on Türkiye’s coastal resorts, prompting hotels to lower rates to fill rooms. Bodrum’s forward demand remains below its usual level throughout Q4, despite short-term rental listings falling sharply.
North America
US markets show the broadest weakness of any region entering Q4. Of 161 North American markets, 58% are advertising a lower rate than last year, 62% recorded fewer hotel searches than a year earlier, and 40 are lower across rate, forward demand and search than the same period last year. The median US advertised rate is down 1.7% YoY, and median hotel search is down 13.8%. In Canada, the median rate is up 4.4% in Canadian dollars, and median hotel search is up 36.1%.
US weakness extends across several major leisure markets
Las Vegas has the region's largest fall in advertised rates. Its Q4 advertised rate is down 20.0% YoY, with similar declines in all three months, and all three months are the lowest of the four years. Forward demand is lower too, and short-term rental supply fell 8.8% over the same period – so this isn't a market absorbing new competition, it's one where demand itself has softened.
The lower rates follow a tourism slowdown that began in 2025, when visitor numbers fell 7.5%. Economic uncertainty has weakened discretionary leisure travel, while fewer Canadian visitors, reduced airline capacity and concerns about the cost and value of a Las Vegas trip have added pressure.
Four Florida Gulf Coast markets have substantially lower advertised rates than a year ago: Q4 rates are down 17.3% YoY in Sarasota, 15.7% in Clearwater Beach, 13.1% in Saint Petersburg and 11.8% in St. Pete Beach. The change is clearest in October. Clearwater Beach has fallen from $292 in 2025 to $246 in 2026, while Sarasota has moved from $182 to $145. Both are now below their hurricane-affected 2024 levels.
The shared decline is consistent with an uneven recovery from Hurricanes Helene and Milton. Local tourism data shows that St. Pete–Clearwater visitor numbers had improved YoY by March 2026 but remained 8.2% below 2024. Meanwhile, short-term rental listings are up 24.9% in Clearwater Beach and 12.8% in Sarasota, adding competition while Clearwater's forward demand has weakened and the wider market has recorded little growth in demand or search. Saint Petersburg has seen a comparable rate decline without additional rental supply, showing that lower advertised rates extend across the Gulf Coast rather than being driven by supply factors alone.
Hawaii's lower Q4 rates reflect weaker search from different source markets. In Honolulu, July hotel search from Japan and South Korea fell sharply, together accounting for around two-thirds of the market's overall decline. Both origins face less favorable exchange rates against the dollar. Japanese travelers also continue to favor cheaper short-haul destinations, while scheduled Q4 air capacity from Seoul is lower. These pressures help explain why Honolulu's Q4 advertised rate is down 13.1% YoY.
Maui's weakness is primarily domestic. US hotel search, which accounts for more than three-quarters of its recorded search volume, fell 18.0%. The island is still rebuilding tourism following the Lahaina wildfire while contending with the high overall cost of a Hawaii trip. Its Q4 advertised rate is down 11.2% YoY and 24.5% from 2024, but the lower rates have not yet seen an uplift in demand.
Domestic search distinguishes Canada from the United States
Domestic hotel search increased by at least 20% across every major Canadian market measured.
Montreal combines a 36.1% increase with a 2.8% higher advertised rate in Canadian dollars and stronger October forward demand. Ottawa (+32.7%), Quebec (+28.0%) and Toronto (+20.1%) show the same domestic-search gain, with rate and demand also tracking ahead of last year.
Halifax and Vancouver enter Q4 after strong tourism and hotel performance in 2025, so their softer forward-demand comparisons partly reflect last year’s high base. Halifax's domestic hotel search increased by around 40% in July, and October forward demand is ahead of last year, but demand weakens in November and falls below the market's usual level in December. Its 10.0% Q4 advertised-rate increase is therefore better supported at the beginning of the quarter than at the end.
Vancouver recorded Canada’s strongest hotel performance in 2025, with the country’s highest occupancy, average rate and revenue per available room. For Q4 2026, its advertised rate is another 16.0% higher YoY in Canadian dollars, even though forward demand has eased to just below the market’s usual level.
Canadian search for US hotels has swung sharply over the past two years and by August 2026 sat close to its 2024 average. However, only 13 of the 148 US markets recorded year-on-year growth in Canadian hotel search at all that month, down from 26 in July. New York (+70.0%), Queens (+75.1%) and Boston (+27.2%) together account for 84% of all the gains recorded in August; strip those three out and the market's other largest destinations were down 16% on their own base.
Sedona's rates fall as demand grows; Park City's December rate rises faster
Sedona, one of the strongest beneficiaries of the growth in drive-to leisure travel, comes into Q4 with advertised rates moving back from historically elevated levels rather than demand falling away. Forward demand is stronger in every Q4 month, but advertised rates are down 14.8% in November and 10.3% in December. With hotel search 7.4% lower and short-term rental listings up 16.0% on this point last year, the market is accommodating resilient stay-date demand across a larger pool of available accommodation.
Park City’s December advertised rate has climbed 33.1% to $641, while forward demand is only slightly higher than last year. July hotel search fell 25.0% and short-term rental listings rose 12.6%. The increase follows Utah’s lowest snowpack on record last winter. A strong El Niño could bring more snow in 2026–27, although the forecast remains uncertain and the strongest signal is for January to March.
Event value depends on overnight demand, not attendance
Lexington’s forward demand during Breeders’ Cup week is roughly twice the corresponding week last year. The event is expected to attract around 85,000 attendees.
San Francisco and Oakland's weaker Q4 positions are concentrated in the October week that hosted Dreamforce in 2025. The conference brought an estimated 40,000–50,000 attendees to San Francisco and was forecast to generate $130 million in local revenue. In 2026, it takes place in September, moving that conference-led demand peak out of Q4. San Francisco's forward demand is higher YoY in November and December, while July hotel search rose 8.7%.
Oceania
Oceania’s Q4 momentum is shifting away from the Australian cities boosted by last year’s Ashes Tests. Newcastle, Sydney and Christchurch now combine stronger forward demand with higher advertised rates, while Adelaide, Melbourne, Perth and Brisbane have eased from their event-supported 2025 peaks. Queenstown stands apart: its advertised rate is up 44.4% despite forward demand remaining almost unchanged.
Newcastle, Sydney and Christchurch have higher rates and stronger demand
Newcastle has Oceania's largest YoY increase in forward demand, with growth across all three Q4 months and demand above both 2025 and 2024. Its advertised rate is up 15.7% to AUD 237, while hotel search from within Australia has risen 20.0%. Rugby League World Cup fixtures contribute to one high-demand October week, but demand is also higher outside the tournament dates.
Sydney's advertised rate is up 9.4% to AUD 361 as forward demand rises above both prior years. Increased search from Australia and New Zealand has offset declines from long-haul origins. Christchurch shows the same broad relationship: its advertised rate is up 17.0% to NZD 333, forward demand is higher than in 2025 and 2024, and domestic hotel search has increased 38.8%.
Queenstown's rate is up 44.4% while Q4 demand is almost unchanged
Queenstown has Oceania's largest increase in advertised rates. Its Q4 rate is up 44.4% YoY to NZD 641, while forward demand is almost unchanged from last year. The difference is widest in October, when demand has returned to its usual level but the advertised rate is 29% higher. Forward demand is higher than last year in November and December, with the strongest period over the late-December summer peak.
The destination continues to attract interest from several important visitor markets. Hotel search has risen 37.4% from Australia, 34.0% from China and 16.4% within New Zealand. Queenstown is the only Oceania market covered in the report where Chinese search increased. Its combination of outdoor experiences, luxury accommodation, dining, wine and wellness has broadened its appeal beyond adventure tourism.
Total hotel search is up 17.0%, while flight search is virtually unchanged. Q4 forward demand is also almost unchanged from last year. Queenstown's higher advertised rates are most closely aligned with demand over the late-December peak; across the rest of the quarter, rates have risen much faster than demand.
Last year's Ashes Tests explain four YoY demand declines
Adelaide, Melbourne, Perth and Brisbane have Oceania's largest YoY declines in forward demand. In each city, however, the decline is concentrated in the month that hosted an Ashes Test in 2025. Forward demand remains higher than in 2024 across all four markets, showing that they have fallen from last year's event-driven peaks rather than below their earlier Q4 levels.
The monthly rate changes reinforce that distinction. December – the 2025 Test month for Adelaide, Melbourne and Brisbane – is the only month in which Adelaide and Brisbane have lower rates and the weakest month for Melbourne. Perth follows the same pattern in November, when it hosted the opening Ashes Test in 2025. Its advertised rate is up 20.6% in Australian dollars from 2024, the largest two-year increase among the Australian markets, while forward demand is also higher than in 2024. With the next Australian home Ashes not scheduled until the 2029–30 summer, the same series-led Q4 uplift will not return during the intervening years.
What the Q4 outlook means for commercial teams
Across most regions, median forward demand remains close to last year, though individual hotels may see very different trading conditions through Q4. The differences that matter commercially are concentrated in particular stay dates, destination types and source-market combinations. Summit hosts, Christmas destinations, ski peaks, summer resorts and traveling sports events can see substantial rate increases, but the largest event-led movements are frequently confined to the stay weeks concerned.
Against that background, two patterns give commercial teams a specific reason to review their assumptions for Q4.
Source markets are changing even where overall demand is holding
Several markets have maintained or increased total hotel search after losing interest from a major origin. Increased European search has offset weaker US search across much of Europe. Japanese and South Korean interest has partly replaced lost Chinese search in Kyoto, while Canadian growth has helped Barbados withstand a decline from the United States. Domestic and regional search is also supporting Foz do Iguaçu, Newcastle, Sydney and Christchurch.
That replacement may protect the size of the search audience, but it does not establish that travelers from these origins will book through the same channels, at the same lead times or for the same rates and stay lengths. A hotel whose total demand appears stable may therefore see a different booking pattern as its source mix changes. Commercial teams have reason to check whether their potential source markets are also appearing in bookings and producing comparable value.
Rate and demand changes point to different pricing questions
Kyoto, Kanazawa, Helsinki, Turin and Sedona all come into Q4 with stronger forward demand but flat or lower advertised rates. Queenstown and Cape Town have much higher Q4 advertised rates with little change in forward demand, while Park City's December rate increase accompanies a much smaller improvement in demand.
For hotels in the first group, the question is whether stronger stay-date demand and current booking pace support a higher rate than the competitive market is advertising. For those in the second, it is whether their booking pace is building quickly enough to sustain the increase.
Following lower market rates can mean missing an opportunity to charge more when a hotel's own demand is stronger. Matching market increases without checking the hotel's own booking pickup can leave rates ahead of demand.
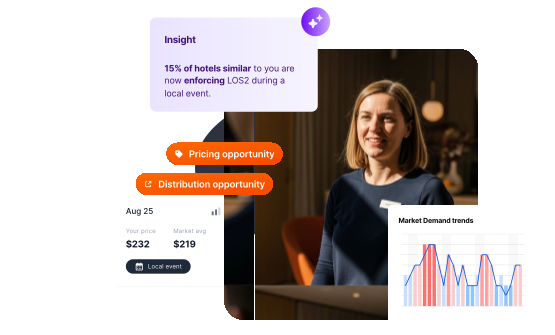
Lighthouse Pricing surfaces the changes in source markets, forward demand and competitive rates behind each case.
Ernest, Lighthouse's AI teammate, gives commercial teams a direct way to question the signals in the context of their own business, investigate the affected dates and set alerts for changes that warrant another look.
Teams can then determine whether their current rate, inventory and distribution assumptions still fit the business forming for Q4.
*Forward demand reflects travel shopping interest for future stay dates, measured against each destination's usual level. It indicates interest rather than confirmed bookings, with year-on-year comparisons made at the same point in the booking cycle.
**Advertised rates refer to the lowest advertised rates, compared at the same booking distance before arrival; they are not average daily rates achieved by hotels.
Loading author...
Your market, made simple
We know you're busy, so we've made it easy to stay on top of your market. Access 90 days of demand, rate, and local event data in a custom dashboard in just 2 minutes.